
Direct Mail Metrics Worth Tracking in 2026

Direct mail metrics worth tracking are measurable performance indicators like response rate, conversion rate, cost per acquisition (CPA), and return on investment (ROI) that determine whether your campaign drives real business outcomes. Most marketers treat direct mail as a black box, but modern tools like UTM parameters, PURLs, and QR codes make every piece of mail as trackable as a digital ad. The difference between a campaign that scales and one that stalls comes down to which indicators you measure, when you measure them, and how accurately you attribute results. This guide covers the core and advanced KPIs every marketing professional needs to run data-driven direct mail in 2026.
1. Which direct mail metrics provide the most actionable insights?
Response rate, conversion rate, CPA, and ROI form the foundation of any direct mail performance framework. Each metric answers a different question about your campaign, and none of them tells the full story alone.
Response rate measures the percentage of recipients who take a defined action after receiving your mail. Direct mail campaigns typically see response rates between 3% and 5%, with well-targeted lists reaching up to 9%. That ceiling matters because it sets realistic expectations before you spend a dollar on postage.

Conversion rate goes deeper than response rate. It measures how many responders completed the desired outcome, whether that is a purchase, a booked appointment, or a signed contract. A 2% response rate with 50% conversion can outperform a 5% response rate with low conversions. Response volume without conversion context is a vanity metric.
Cost per acquisition connects your total campaign spend to the number of new customers generated. CPA is the metric marketing leadership actually cares about because it translates mail spend into business language. Measuring KPIs in revenue and CPA terms rather than response counts helps justify budget to the C-suite.
Return on investment is the comprehensive financial performance indicator. It requires a full conversion window to calculate accurately. ROI measurement needs 30–90 days to capture late responders who act weeks after receiving a piece. Closing the books too early systematically undercounts your results.
Pro Tip: Build your ROI calculation template before the campaign launches. Lock in your cost inputs, expected conversion window, and revenue attribution rules so you are not reverse-engineering assumptions after the fact.
2. How to set up direct mail tracking infrastructure
Tracking setup must happen before mail drops. Setting it up after the fact guarantees attribution gaps that no analysis can fully close.
- Create campaign-specific landing pages. Each mail version needs its own URL. Generic homepage traffic cannot be segmented by campaign, offer, or audience.
- Add UTM parameters to every URL. Use
utm_medium=direct_mailand uniqueutm_campaignvalues for each drop. Custom GA4 channel groups are necessary to prevent direct mail traffic from being misclassified as organic or direct. - Generate unique tracking phone numbers. Assign a distinct number to each mail version. Call tracking services typically cost $10–$30 per month and take under two hours to configure alongside QR codes and landing pages.
- Use PURLs for per-recipient tracking. Personalized URLs like
yoursite.com/john-smithlet you track individual engagement at the household level. PURLs and QR codes combined give you both aggregate and individual response data. - Deploy QR codes for mobile engagement. Static QR codes track aggregate scans. Dynamic QR codes let you update the destination URL after printing, which is useful for A/B testing offers post-drop.
- Connect everything to your CRM. Tag every inbound lead with the campaign source at the point of entry. The major obstacle to accurate ROI is missing clean source-tagging in the CRM, not the tracking tools themselves.
Pro Tip: Run a full tracking test with a seed list of internal addresses before the main drop. Confirm that QR codes fire correctly, UTM parameters pass through to GA4, and phone calls route to the right tracking number.
3. What advanced attribution techniques improve measurement accuracy?
Standard tracking tools capture responders who scan a QR code or visit a PURL. They miss everyone who converts through a different channel after receiving your mail. Advanced attribution methods close that gap.
| Technique | How it works | Best use case |
|---|---|---|
| Matchback analysis | Joins mailing list to sales data 30–90 days post-campaign without requiring tracking codes | Capturing offline conversions from recipients who never scanned or clicked |
| Holdout group testing | Excludes 10% of audience from mailing and compares conversion rates between mailed and non-mailed groups | Measuring true incremental lift and isolating campaign causality |
| Multi-touch attribution | Combines offline mail signals with online touchpoints like email opens and paid ad clicks | Campaigns running across multiple channels simultaneously |
Matchback analysis requires an encrypted export of your mailing list and integration with sales logs. It identifies offline conversions that no QR code or PURL would ever capture. This method is especially valuable for high-value B2B campaigns where prospects research independently before buying.
Holdout group testing is the gold standard for incrementality. By withholding mail from a random 10% of your audience, you create a control group that reveals how many conversions would have happened anyway. The difference between the mailed group and the holdout group is your true campaign lift.
Multi-touch attribution is the most complex option. It works best when your direct mail runs alongside email, paid search, or social retargeting. Combining offline and online signals gives you a full picture of the customer journey, but it requires clean data integration across every channel.
4. Secondary metrics and long-tail signals that complete the picture
Primary KPIs tell you what happened. Secondary metrics tell you why, and they often reveal campaign impact that response rate alone would miss.
- Branded search volume spikes. A direct mail drop to 50,000 households reliably produces a measurable increase in branded Google searches within 7–14 days. Monitor Google Search Console for your brand name after each drop date.
- Website traffic surges. Track direct and organic traffic in GA4 segmented by geography. If you mailed to ZIP codes in the Pacific Northwest, a traffic spike from that region after the drop is attributable to the campaign.
- Response latency. Long-tail conversions happen 14–90 days after mailing. Early partial data is almost always insufficient for final ROI calculations. Build a 90-day reporting window into every campaign plan.
- Average order value (AOV). A campaign that drives lower response but higher AOV can generate more revenue than a high-response, low-ticket campaign. AOV tells you whether you are attracting the right customers, not just more customers.
- Revenue per order. Pair this with CPA to calculate true margin per acquired customer. A $40 CPA on a $200 average order is a fundamentally different business outcome than a $40 CPA on a $60 average order.
Combining immediate response data with longer-term financial KPIs gives you the full picture needed to optimize campaigns effectively. Single metrics yield incomplete insights. The marketers who win are the ones who read the full signal stack, not just the first week’s scan data.
Pro Tip: Set a calendar reminder for 30, 60, and 90 days after each mail drop. Pull your matchback report and AOV data at each interval. You will consistently find revenue you would have missed with a 7-day reporting window.
5. How to compare direct mail performance against benchmarks
Benchmarks give your metrics context. Without them, a 3% response rate looks the same whether your campaign was a success or a failure.
Response rates vary significantly by industry. Financial services, retail, and healthcare consistently lead direct mail usage and tend to see higher baseline response rates than general B2C categories. A 3% response rate in a cold-prospect campaign is solid. The same rate in a reactivation campaign targeting lapsed customers signals underperformance.
CPA benchmarks depend entirely on your customer lifetime value (LTV). A $150 CPA is excellent for a subscription product with a $1,200 annual LTV. It is unsustainable for a one-time purchase product with a $90 average order. Always anchor your CPA target to LTV before the campaign launches, not after.
ROI benchmarks for direct mail vary by list quality, offer strength, and creative execution. Well-targeted campaigns with strong offers consistently outperform broad-reach campaigns with generic creative. The direct mail vs. email comparison is worth running for your own audience because the channel that wins depends on your specific list quality and offer type.
Key takeaways
Measuring direct mail campaign success requires tracking response rate, conversion rate, CPA, and ROI together, supported by advanced attribution methods and a full 90-day conversion window.
| Point | Details |
|---|---|
| Track four core KPIs | Response rate, conversion rate, CPA, and ROI each answer a different campaign question. |
| Set up tracking before the drop | UTM parameters, PURLs, and unique phone numbers must be configured before mail ships. |
| Use matchback and holdout tests | These methods capture offline conversions and true incremental lift that standard tracking misses. |
| Extend your reporting window | Long-tail conversions arrive 14–90 days post-drop; close the books too early and you undercount ROI. |
| Read secondary signals | Branded search spikes and geographic web traffic surges confirm campaign reach beyond direct responses. |
What I have learned after years of watching direct mail campaigns succeed and fail
The most common mistake I see is treating response rate as the headline metric. Marketers celebrate a 6% response rate and then discover the CPA is three times their target because the responders were low-intent browsers, not buyers. Response rate is a leading indicator. CPA and ROI are the actual scorecards.
The second mistake is skipping the holdout group. I understand the instinct. Withholding mail from 10% of your audience feels like leaving revenue on the table. But without a holdout, you cannot separate campaign-driven conversions from customers who would have bought anyway. You end up attributing organic demand to your mail budget, which inflates ROI and leads to overspending on future campaigns.
The tracking infrastructure piece is where most teams cut corners. They launch the campaign, then try to figure out attribution afterward. Clean source-tagging in your CRM is not a nice-to-have. It is the foundation that every downstream metric depends on. I have seen campaigns with genuinely strong ROI look mediocre on paper simply because the tracking was set up a week after the drop.
My honest recommendation: start with the four core KPIs, add a holdout group on your next campaign, and build a 90-day reporting calendar before you mail a single piece. That combination will give you more reliable data than any sophisticated attribution model built on a broken tracking foundation.
— James
How Envypak helps you get more from every mail piece
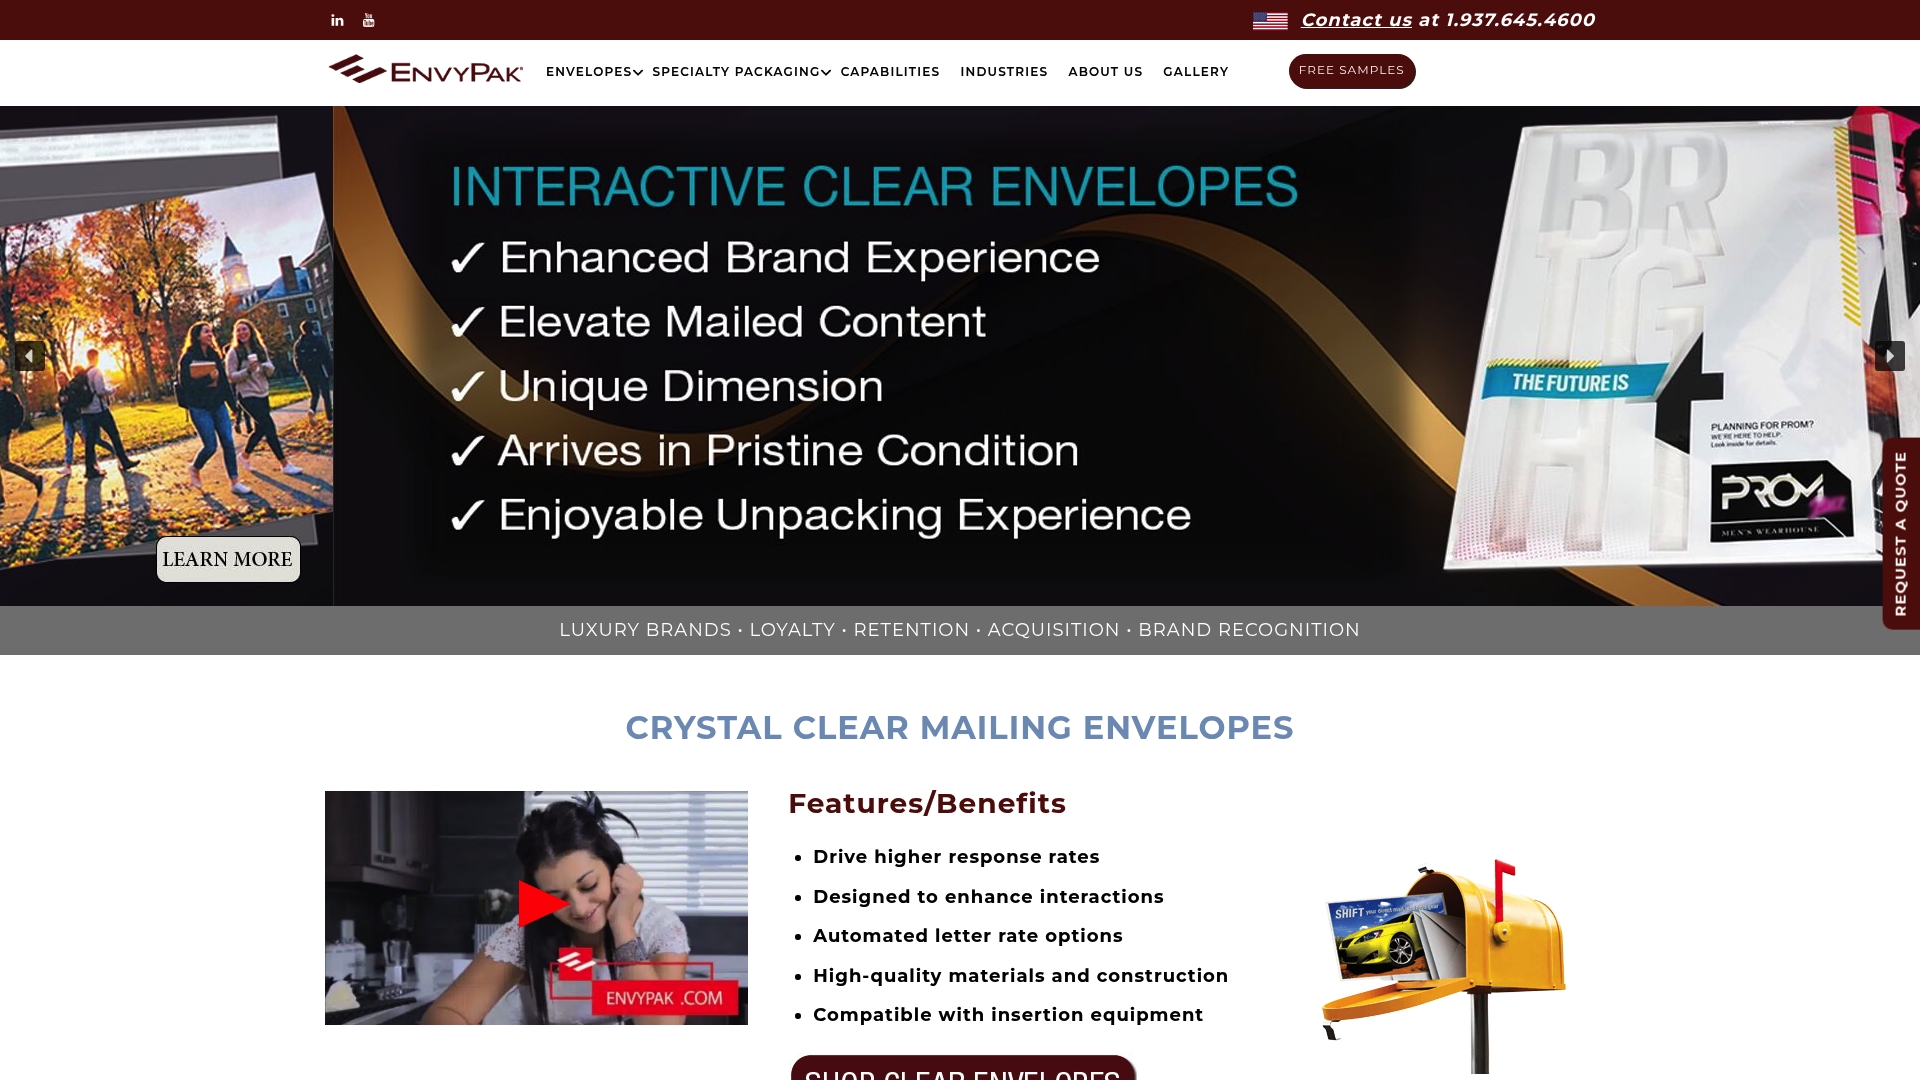
The metrics you track are only as good as the mail piece that generates the response. Envypak’s crystal clear mailing envelopes make your offer visible before the recipient even opens the envelope, which directly lifts response rates and gives your tracking infrastructure more signals to measure. Envypak’s envelopes are automation-compatible and built from eco-friendly materials, so they work with high-volume production runs without sacrificing presentation quality. For campaigns using QR codes or PURLs, the clear window design keeps your call-to-action and tracking elements front and center. See how real campaigns performed with Envypak mailers at the direct mail result stories page.
FAQ
What are the most important direct mail metrics to track?
Response rate, conversion rate, cost per acquisition, and ROI are the four core direct mail performance indicators. Each metric measures a different stage of campaign effectiveness, from initial engagement to financial return.
How long does it take to measure direct mail ROI accurately?
ROI measurement requires a 30–90 day window to capture late responders. Closing your reporting period at 7 or 14 days systematically undercounts conversions and produces misleading ROI figures.
What is matchback analysis in direct mail?
Matchback analysis joins your mailing list to sales data after the campaign to identify offline conversions that occurred without a QR scan or PURL visit. It captures revenue that standard tracking tools miss entirely.
How do UTM parameters work for direct mail tracking?
UTM parameters tag your campaign-specific URLs so GA4 records which traffic came from your mail drop. Setting utm_medium=direct_mail with a custom GA4 channel group prevents this traffic from being misclassified as organic or direct.
Why does a high response rate not always mean a profitable campaign?
A high response rate only measures initial engagement. If responders do not convert or generate sufficient order value, the campaign can still produce a negative ROI. Conversion rate and average order value provide the context that response rate alone cannot.